Top Primary Silver Miners Q1 2015 Results: Still Losing Money Even With Lower Costs
According to the U.S. Energy Information Agency (EIA), the average price of a barrel of Brent crude in Q1 2015 was $53.92, down nearly 50% from $101.82 in Q3 2014. This helped to lower costs for the primary silver miners considerably. Unfortunately, the average realized silver price the miners received in Q1 2015 fell even further.
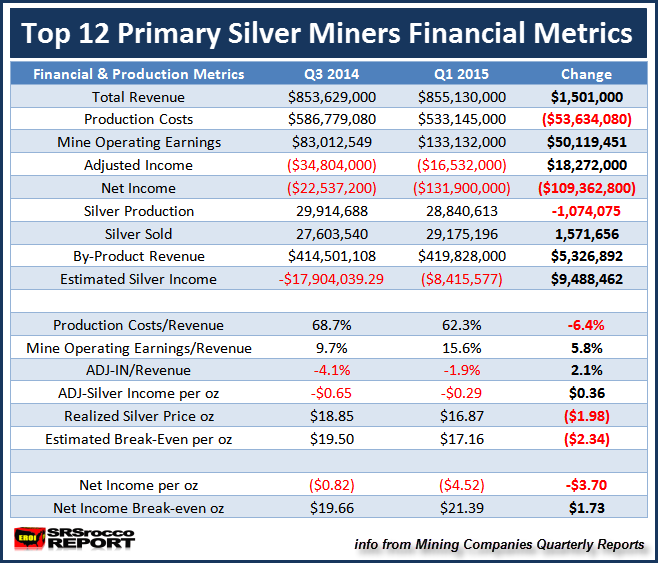
The table below compares the Top 12 primary silver miners financials from Q3 2014 to Q1 2015. Because many of the silver mining companies do not publish separate quarterly statistics with their year-end results (Q4), I do not post results for the last quarter of the year. Instead, I publish FULL YEAR results.
If we look at the table below, we can see that the group’s revenue didn’t change all that much from Q3 2014 to Q1 2015. Total revenues only increased $1.5 million from $853 million to $855 million due to lower realized silver prices balanced out by higher sales of silver (1.5 million oz) and increased by-product base metal and gold sales:
Now, the data that showed the biggest difference was the change in the group’s production cost. Total production cost for the group fell nearly 10% ($53 million) from $586 million in Q3 2014 to $533 million Q1 2015. While the group’s total silver production declined 1 Moz in Q1 2015 compared to Q3 2014, the majority of the cost decline came from lower oil-energy prices.
As we can see, lower production costs had a positive impact on mine operating earnings. The group’s mine operating earnings increased $50 million (shown in the change column on the right) due to lower production costs of $53 million.
