SILVER EAGLES vs GOLD EAGLES: Two Charts You Have To See
The U.S. Mint started selling Gold and Silver Eagles in 1986. The first year the U.S. Mint produced these coins, 1,787,750 oz of Gold Eagles were sold compared to 5,096,000 Silver Eagles… a 3 to 1 ratio. That was the first and last year, the Silver-Gold Eagle ratio was that low.
Let’s first look at the Gold Eagle sales chart:
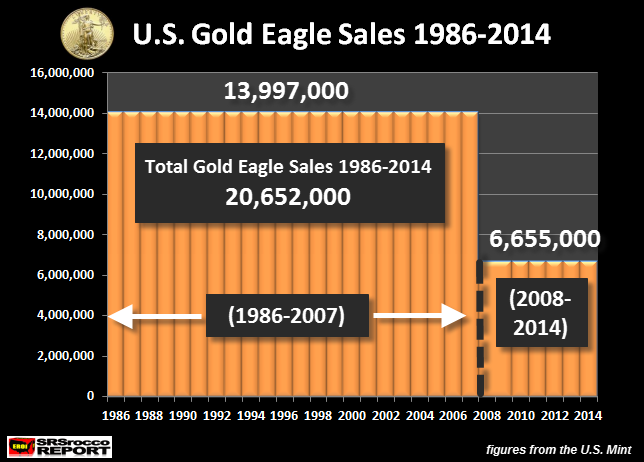
I decided to break down the chart into two separate time frames. We have the total sales from 1986-2007 (before the collapse of the U.S. Investment Banking and Housing Industry), and then after from 2008-2014. As we can see, total sales from 1986-2007 were 13,997,000 oz of Gold Eagles compared to 6,655,000 oz during the 2008-2014 time period.
If we divide the total of Gold Eagle sales from these two time periods by the number of years, we have the following:
Gold Eagle Annual Sales Average
(1986-2008): 13,997,000 / 22 years = 636,227 oz avg. per year
(2008-2014): 6,655,000/ 7 years = 950,714 oz avg per year
So, after the U.S. economy and financial system teetered on the brink of collapse, the U.S. Mint sold an average of 950,714 oz of Gold Eagles annually compared to the 636.227 oz per year prior to 2008.
Furthermore, the total Gold Eagles sold from 1986 to 2014 was 20,652,000 oz. This is a great deal of gold investment at a little more than 652 metric tons (mt). Now, let’s compare the this to the Silver Eagle sales market.